Software Regression Testing – A Day in the Life of
When we undertake a regression testing effort, we like to do a regression testing analysis to see the efficiency and efficacy of what we are doing. Applying a combined effort of executing test cases along with exploratory testing, we like to examine what is happening as a barometer on trends of issues testing which may help us to adapt our approach on any given day.
Defects Found by Test Cases Versus Exploratory
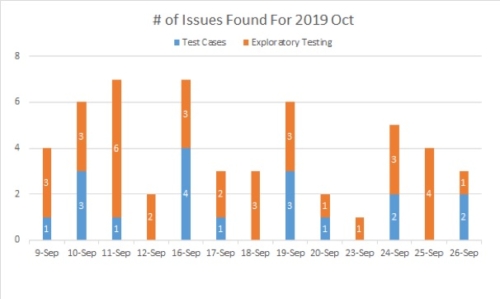
At the beginning of the regression, we use a histogram to record the number of issues found each day. The bar graph shows how many issues are found in the test cases and how many issues are found using exploratory testing for each day in the regression test cycle.
Defects Found By Method Over Time
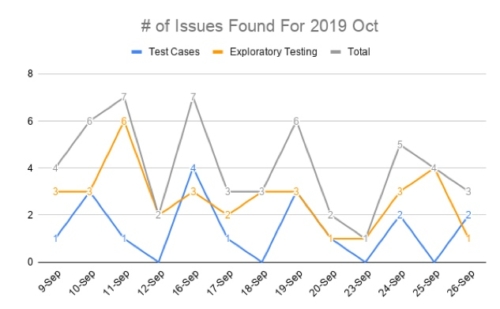
As the testing progresses day by day, we like to use a line chart to understand the trends in issues (found by test cases and exploratory testing). According to this chart, we can see which stage in regression has found more issues. At the beginning of regression, the number of issues is found is higher because, in addition to executing high priority test cases to ensure there are no outstanding issues for the critical path (high priority user stories), we also execute the test cases and exploratory testing for the new features in this release. We put the testing of new features at the beginning of the regression because we want to have enough time for developers to fix the problem. Additionally, test engineers, have enough time to do related re-testing as needed.
In the middle of regression, the number of issues gradually decreases because we execute the test cases of base regression and some exploratory testing for the existing functionality. The functionality in the base regression has been tested in the previous regression and released to the customers in the previous releases, so hopefully, the issues found should decrease.
In the end of regression, the number of issues will not always decrease to zero because even if all test cases have been executed because we continue to do exploratory testing.
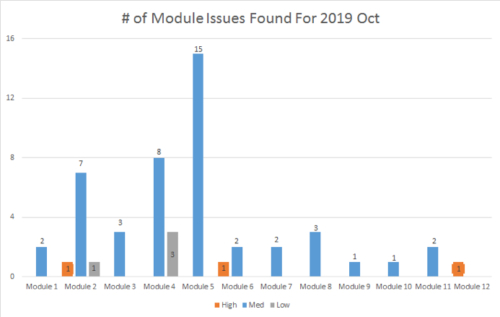
Towards the end of regression testing, we like to analyze how many bugs are found in each module with all issues in each module sorted by their priority. This enables us to clearly see the release risk of each module.
Defects Found Per Module
For example, you can see the numbers of the issues in Module 2, Module 4 and Module 5 are more than other modules. And module 2 has one high priority issue. That usually means the code or functionality changes in these modules in this release are more than other modules. Therefore, we should focus on these high-risk modules with additional exploratory testing to reduce the release risk.
Next Steps – Automation and Artificial Intelligence (AI)
The next steps are, of course, test automation and AI. Where can and should we use them and why? Naturally, all those test cases that are executed manually need to be examined for automation suitability. Some criteria for this may include:
- Number of times executed and failures found – If it needs to be executed on multiple platforms and failures are found frequently, then it’s a perfect candidate.
- The criticality of the test case – either in user function importance or frequency of use.
- Ease of automation – sometimes, it’s just hard to automate depending on the controls and their behavior and sequence.
The trend these days is to use Artificial Intelligence, in particular, machine learning, as an aid to, or type of test automation. We’ve tried a few tools to do this, but at this point, we don’t feel the space is mature enough to warrant going down this path. There are so many tools claiming AI for a variety of automation tasks, but not all are created equal and have wide ranges of effectiveness. We’ll revisit it in 6 months.
Leave A Comment